12.14.2009

The Human Poverty Index (HPI) is an indication of the standard of living in a country, developed by the United Nations (UN). For highly developed countries, the UN considers that it can better reflect the extent of deprivation compared to the Human Development Index (HDI).

There are two separate formulas for calculating the HPI. One formula measures the poverty index in developing countries. The Human Development Reports (HDR) website summarizes the first formula as a composite index measuring deprivations in the three basic dimensions captured in the HDI — a long and healthy life, knowledge and a decent standard of living (HDR 2009). This first formula, called HPI-1, is calculated using three factors:
  1. Probability at birth of not surviving to age 40.
  2. Adult literacy rate.
  3. Unweighted average of population without sustainable access to an improved water source and children underweight for age.
The second formula measures the poverty index of the 30 countries making up the Organization for Economic Co-operation and Development (OECD). OECD members are high-income economies with a high HDI and are regarded as developed countries. A list of these countries can be found here. The (HDR) website summarizes this second formula as a composite index measuring deprivations in the three basic dimensions captured in the HDI — a long and healthy life, knowledge and a decent standard of living - and also capturing social exclusion (HDR 2009). This second formula, called HPI-2, is calculated using four factors:
  1. Probability at birth of not surviving to age 60.
  2. Adults lacking functional literacy skills.
  3. Population below income poverty line (50% of median adjusted household disposable income).
  4. Rate of long-term unemployment (lasting 12 months or more).
All the information is calculated into a complex formula which then yields a corresponding percentage for each country. In this case, the lowest percentage means the lowest poverty index. Shown below is a graph for 20 of the OECD countries using the HPI-2 formula. All twenty countries listed below have HDI values in the top 25. Two countries that have very high HDI values, but are not reflected below are Iceland and New Zealand. These are notable exceptions because generally a country's HDI will correspond to its HPI.
As already discussed, one of the factors that measures a country's HPI is the probability of the population not reaching a certain age. The graph below illustrates the formula, HPI-2, examining selected OECDs and their corresponding death mortality for people reaching the age of 60.Another factor looking at the HPI of the OECDs is long-term unemployment. This demographic contains far greater discrepancies, with some countries (including the USA having the world's lowest at 0.4%) while other countries like Germany and Belgium having far greater unemployment figures. The graph below lists the same 20 OECD countries as the one above. Yet another factor calculated into a country's HPI is the percentage of the population below 50% of the median GDP per capita income. This is also a measure of economic inequality within a country. As shown on the graph below, the USA has the highest percentage of people living in poverty (as characterized by making less than 50% of median income). This poverty measurement is not a universal formula, however. The US defines the poverty threshold at a household's monthly food expenditures times three. Using this formula, the poverty level in this country is less than the 17% figure listed below; current estimates have the poverty rate at 13.2% - though this 11-year high is attributed mainly to the recession. (Homan & Dorning, 2009).The graph listed below combines the four factors that are in the HPI-2 formula for selected OECD countries. Click to enlarge

References

Homan, T.R., & Dorning M. (2009, September 10). U.S. Poverty Rate Rises to 11-Year High as Recession Takes Toll. Bloomberg News. Retrieved December 13, 2009, from http://www.bloomberg.com/apps/news?pid=20601087&sid=aDIvtqxX.pxY

“Human Poverty Index”. (2009, December 8). Wikipedia. Retrieved December 13, 2009, from http://en.wikipedia.org/wiki/Human_Poverty_Index

Human Development Report 2009. United Nations Development Programme. 2009. Retrieved from http://hdr.undp.org/en/media/HDR_2009_EN_Complete.pdf



12.12.2009

Gender Empowerment Measure

The Gender Empowerment Measure (GEM) pertains to the issue of gender-related development and the GDI. The GEM, however, is more specific; it compares the ability of men and women to participate in economic and political decision making. Simply put, the GEM measures the inequalities of men and women in a country. It, along with the GDI, is one of five indicators the UN uses in its annual Human Development Report.

The GEM combines inequalities in three areas: political participation and decision making, economic participation and decision making, and power over economic resources. Calculating the GEM involves several steps. Percentages for females and males are calculated in each area of the following areas:
  1. The number of parliamentary seats held.
  2. a) The number of legislators, senior officials, and managers b) The number of professional and technical positions.
  3. Estimated earned income (at purchasing power parity US$).
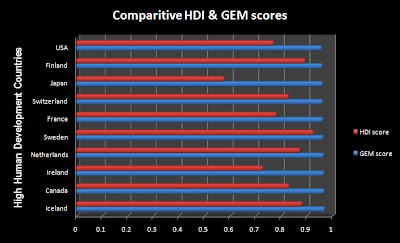
The GEM is calculated from the unweighted average of the these three areas and a score of o to 1 is assigned. As with the Gender-related Development Index, no country in the world has achieved a score of 1 - denoting perfect gender equality. A country's GEM score reflects loosely on its overall Human Development Index (HDI) score. The countries with the ten highest HDI scores also have six of the highest GEM scores. Below is a representation of how some of the countries with high human development (i.e. high HDI score) relates to their respective GEM.

* It is interesting to note that no country has a GEM that is proportionate to its HDI. Because a country's GEM is not calculated into its HDI, it is not an effective means to evaluate direct comparisons. The graph does, however portray the gender inequalities in each of these MDCs. Equality should play a central component into how a country is "measured" and there seems to be universal discrepancies in this regard.


The various graphs below indicate different aspects that affect the GEM.

Although this graph only represents a handful of countries, it is interesting that many developing countries have significantly higher gender equality in regards to parliamentary seats held by women than do some developed countries. However, when analyzing this aspect of the GEM as a whole, more MDCs do possess greater gender equality, with Western Europe ranking first in the world, while the Middle East ranks last.


Again it is worthy to note that the proportion of women in political participation and decision making, and economic participation and decision making is not necessarily consistent with a country's level of development. Mongolia - a developing country has one of the highest percentage of female legislators, senior officials, and managers. Japan and Switzerland, on the other hand, hold top spots on global HDI rankings but have relatively low gender equality in this aspect.


Again, the graph shows the inequality in men earned income over women. When strictly looking at this aspect of gender inequality, there seems to be no distinct difference between MDCs and LDCs. Qatar, a developed country has the one of the world's worst discrepancies, second only to Saudi Arabia. Japan, however, one of the world's leading industrialized nations possesses great inequality of women income - with females making less than half of what men do. The GEM poses some rather surprising information and clearly shows there is still much work to be done in the realm of gender equality.

References

“Gender Empowerment Measure”. (2009, November 29). Wikipedia. Retrieved December 12, 2009, from http://en.wikipedia.org/wiki/Gender_Empowerment_Measure

Human Development Report 2009. United Nations Development Programme. 2009. Retrieved from http://hdr.undp.org/en/media/HDR_2009_EN_Complete.pdf

“Measuring inequality: Gender Empowerment Measure (GEM)”. (2009). United Nations Development Programme. Retrieved from http://www.mcgill.ca/files/ids/HDR_20072008_GEM.pdf


12.11.2009

Gender-related Development Index

The Gender-related Development Index (GDI) is an indication of the standard of living in a country, developed by the United Nations (UN). Although not used to compute the HDI, it is one of the five indicators used by the UN Development Programme in its annual Human Development Report (HDR). The GDI measures achievement in the same basic capabilities as the HDI does, but takes note of inequality in achievement between women and men. The GDI is simply the HDI discounted, or adjusted downwards, for gender inequality. The downward adjustment is due to the fact that no country in the world has achieved complete gender equality (“Measuring Inequality”, 2009).


The GDI aims to show the inequalities between men and women in the following areas: long and healthy life, knowledge, and a decent standard of living. (“Gender-related”, 2009). Decent standard of living is a broad and unambiguous phrase. In the context of the GDI, standard of living is generally measured by standards such as real income per person and poverty rate.


Calculating the GDI involves three criteria:

  1. life expectancy
  2. education (the adult literacy rate and the combined gross enrollment ratio)
  3. estimated earned income (at purchasing power parity in US$)

Unit-free indices between 0 and 1 are calculated for females and males in each of the above areas. No country in the world has attained a 1 (1 is a perfect score and denotes complete gender equality in the above fields). The methodology used imposes a penalty for inequality, such that the GDI falls when the achievement levels of both women and men in a country go down or when the disparity between their achievements increases. The greater the gender disparity in basic capabilities, the lower a country’s GDI compared with its HDI. Though the GDI does not directly affect a country’s HDI value, there are very close associations with gender equality and human development. For example, the countries that have the 25 highest HDI rankings also have the 25 highest GDI rankings. The inverse also holds true: the countries defined as having low human development also possess the lowest GDI rankings. The region with the greatest inequality is, by far, Sub-Sahara Africa, with 45 of its 47 countries ranking in bottom 50 GDI slots.

Though there are worldwide gender discrepancies, the UN has reported significant decreases since the 1970s. From 1970 to 1992, the global GDI values improved 48% from .432 to .638. Developing countries saw the greatest change; in that same period they had a 62% increase from .345 to .560 (HDR, 1995). These are certainly optimistic figures and more recent data has shown global gender equality is at an all-time high. Official data on the GDI has been collected since 1995 – the first year it published its findings – and has steadily shown improvements in gender equality. The maps below shows 2007 GDI values according the HDR (2009).


A great site for viewing and analyzing gender statistics and other human development aspects for various countries is:

http://globalis.gvu.unu.edu/indicator_detail.cfm?Country=ID&IndicatorID=15

In addition, the link below shows an interesting comparison chart of the GDI and its components published in the UN’s 2009. It clearly demonstrates the relationship gender inequality has on a country’s HDI score.

http://hdr.undp.org/en/media/HDR_2009_EN_Table_J.pdf


References

“Gender-related Development Index”. (2009, October 22). Wikipedia. Retrieved December 11, 2009, from http://en.wikipedia.org/wiki/Gender-related_Development_Index

Human Development Report 1995. United Nations Development Programme. 1995. Retrieved from http://hdr.undp.org/en/media/hdr_1995_en_chap3.pdf

Human Development Report 2009. United Nations Development Programme. 2009. Retrieved from http://hdr.undp.org/en/media/HDR_2009_EN_Complete.pdf

“Measuring inequality: Gender-related Development Index (GDI)”. (2009). United Nations Development Programme. Retrieved from http://hdr.undp.org/en/statistics/indices/gdi_gem/